Proclivity of Wind Power
System Specifications
I decided to design a system with a constant demand of 26 MW. That power can be supplied either by 100 WES30 (a Dutch manufacturer) wind turbines (each rated at 260 kW) or a 26 MW monolithic gas turbine with a peak efficiency of 46.0 %. However, the efficiency of the system declines at lower loads [Figure 1]. Figure 1: Efficiency versus load for gas turbine.
Typically we would expect a capacity factor of about 20 % for wind turbines. This correlates to a 20 % penetration of the energy supply by wind in my example, a commonly held 'threshold' for where we expect to see significant problems emerge.
 Figure 2: Turbine power output versus wind speed. Cuts out at about 4 m/s and feathers at 260 kW and 18 m/s.
Turbine output is similarly variable with wind speed [Figure 2]. Notice that the wind turbine with the 300 kW rating maxes out at 260 kW. The hourly wind data is for Block Island, RI, USA (I would have preferred Cape Cod but I don't have any) with an average windspeed of 4.83 m/s.
In addition to the experimental case, I also designed a reference which was 100 % gas in order to compare the CO2 emissions and cost.
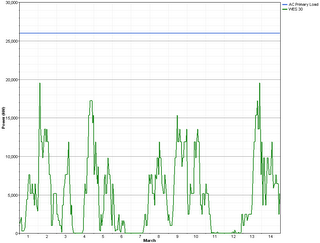 Figure 3: Hourly turbine output for two weeks in March (click to see larger image).
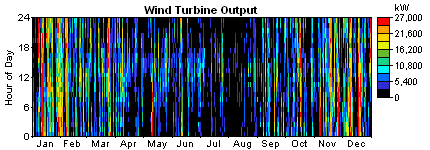 Figure 4: False-colour graph of wind power output as a function of time and date.
As we can see from [Figure 4] there is significant variation in the wind output both hour to hour and seasonally. Note the large black spots in the summer months; long periods of low power production are obviously a huge drawback if you are trying to use some sort of storage system like batteries. It implies you need a great big buffer. Alternatively, if you are trying to do load following with a gas turbine, you can't rely on any of the wind power being steady. In fact, you have to maintain the same power plant capacity with wind as you do without. All of the capital investment in wind needs to be offset through lower fuel consumption of fossil resources.
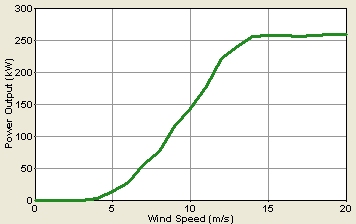 Figure 2: Turbine power output versus wind speed. Cuts out at about 4 m/s and feathers at 260 kW and 18 m/s.
Turbine output is similarly variable with wind speed [Figure 2]. Notice that the wind turbine with the 300 kW rating maxes out at 260 kW. The hourly wind data is for Block Island, RI, USA (I would have preferred Cape Cod but I don't have any) with an average windspeed of 4.83 m/s.
In addition to the experimental case, I also designed a reference which was 100 % gas in order to compare the CO2 emissions and cost.
Results
The wind turbines ended up meeting 21 % of the total demand with an average power output of 5.467 MW. Of course, the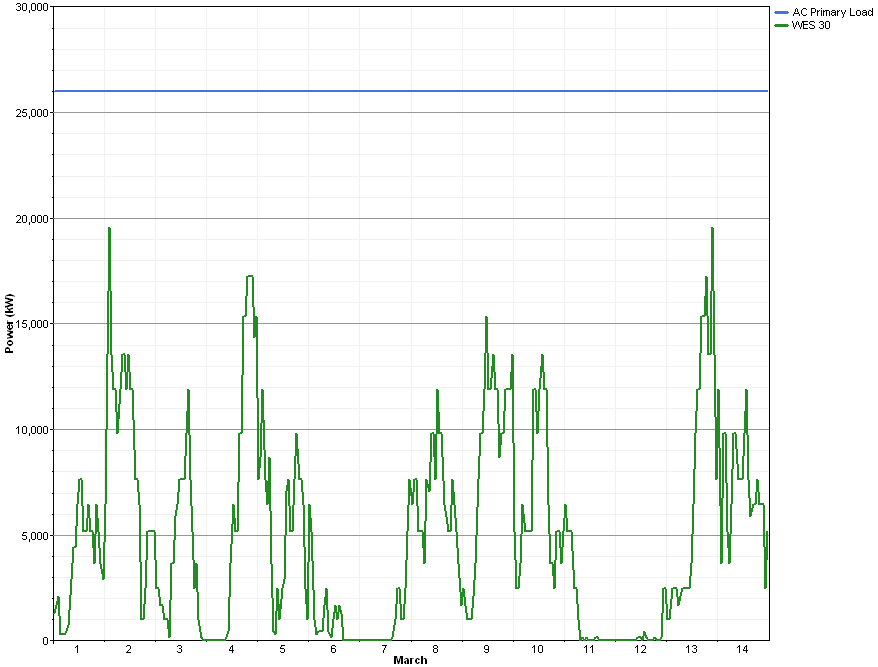 Figure 3: Hourly turbine output for two weeks in March (click to see larger image).
 Figure 4: False-colour graph of wind power output as a function of time and date.
As we can see from [Figure 4] there is significant variation in the wind output both hour to hour and seasonally. Note the large black spots in the summer months; long periods of low power production are obviously a huge drawback if you are trying to use some sort of storage system like batteries. It implies you need a great big buffer. Alternatively, if you are trying to do load following with a gas turbine, you can't rely on any of the wind power being steady. In fact, you have to maintain the same power plant capacity with wind as you do without. All of the capital investment in wind needs to be offset through lower fuel consumption of fossil resources.
Sources of Error
There are a number of issues I am glossing over here which favour either side of the argument. For wind power, I am calculating the power output for a single set of wind data. If turbines are geographically separated, they gain the advantage of sample averaging. The wind will tend to blow more steadily if averaged over a larger area.Against wind power, I am modeling demand as constant. This is quite wrong -- in fact the hourly and seasonal variations in electricity demand are quite substantial. This means that not only does the load-following gas turbine have to coup with the volatility of wind but also that of the consumer. One point of interest is that the gas turbine runs continuously -- it never has to stop -- which isn't realistic either.
Also, one should consider that the location of the wind turbine is quite important. Studies from the UK and Germany have come to widely diverging conclusions on the utility of wind. This is largely due to the differences in geography. The wind tends to blow more steadily in some areas. While companies may be picking their wind farm locations based on mean wind speed perhaps they should be just as concerned with the higher order statistical moments (variance, skewness, and kurtosis).
Comments 0
EmoticonEmoticon